

Docs menuexpand_more
Guides
What you can build with this API
The examples use real screens from StockClub, a Japanese stock research site run by the same company (Crabgrass Inc.), captured on 22 October 2026, and mini-components drawn from saved responses of the ZENITH Code dev environment (fetched 2026-10-23). This explains how to build the same views with the ZENITH Code API, not how StockClub itself is built.
1. Dividend summary card
The dividend summary at the top of StockClub’s dividend page puts the forecast yield, annual dividend, payout ratio, DOE and years without a cut on one card. With ZENITH Code you build the same card from four endpoints.
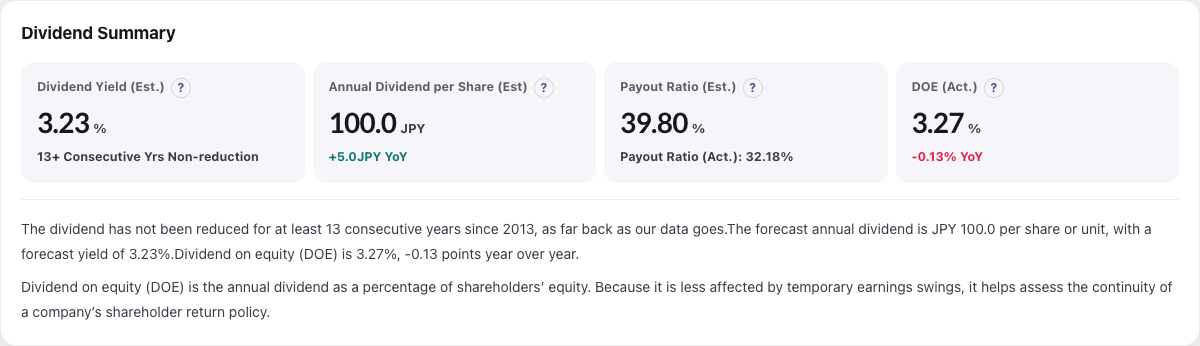
- 1/stable/dividends: the row with dividendType annual and forecastOrActual forecast is this year’s forecast annual dividend per share (split-adjusted).
- 2/stable/key-metrics?period=annual: payoutRatio and doe (dividend on equity) are decimal ratios (0.3218 = 32.18%).
- 3/stable/dividend-streaks: consecutiveNonDecreaseYears is the number of years without a cut, consecutiveIncreaseYears the number of years of increases.
- 4For the forecast dividend yield, use dividendYield from /stable/profile (calculated from the latest close).
Drawn from a ZENITH Code response (TOYOTA MOTOR CORPORATION)
Drawn from the Toyota Motor (7203) sample responses. The dividend yield is calculated from the share price, so it is left out of this example.
const BASE = "https://api.zenithcode.net/stable";
  const headers = { "x-api-key": process.env.ZENITH_API_KEY };
  const get = (path) => fetch(BASE + path, { headers }).then((r) => r.json());

  const [dividends, metrics, streaks] = await Promise.all([
    get("/dividends?symbol=7203&limit=10"),
    get("/key-metrics?symbol=7203&period=annual&limit=1"),
    get("/dividend-streaks?symbol=7203"),
  ]);

  const annualForecast = dividends.find(
    (d) => d.dividendType === "annual" && d.forecastOrActual === "forecast",
  )?.amount;                                   // 100 (JPY)
  const payoutRatio = metrics[0].payoutRatio;  // 0.3218 -> 32.18%
  const doe = metrics[0].doe;                  // 0.0327 -> 3.27%
  const nonCutYears = streaks[0].consecutiveNonDecreaseYears; // 13
2. Dividend history chart
A bar chart of the annual dividend per fiscal year. The years array of /stable/dividend-streaks already holds the split-adjusted annual dividend and the change from the previous year, so you can plot it as is.
Toyota Motor (7203) annual dividend (JPY)
- 1Call it with symbol and limit (up to 25 fiscal years).
- 2Use annualDividend in years as the bar height and change (increase, unchanged, decrease and so on) for colours or labels.
- 3When matchesReported is true, the streak calculated from the annual dividends matches the value counted separately by the data pipeline.
Endpoints used
curl "https://api.zenithcode.net/stable/dividend-streaks?symbol=7203&limit=10" \
  -H "x-api-key: YOUR_API_KEY"
3. Income statement summary
The P/L summary on StockClub’s income statement page shows revenue and net income for the trailing twelve months (TTM) and operating income and EPS year-to-date, each with the year-on-year change. Below them sit the last five years of results and full-year progress against the company forecast. Japanese quarterly figures are cumulative from the start of the fiscal year, so you calculate TTM from the rows you receive.
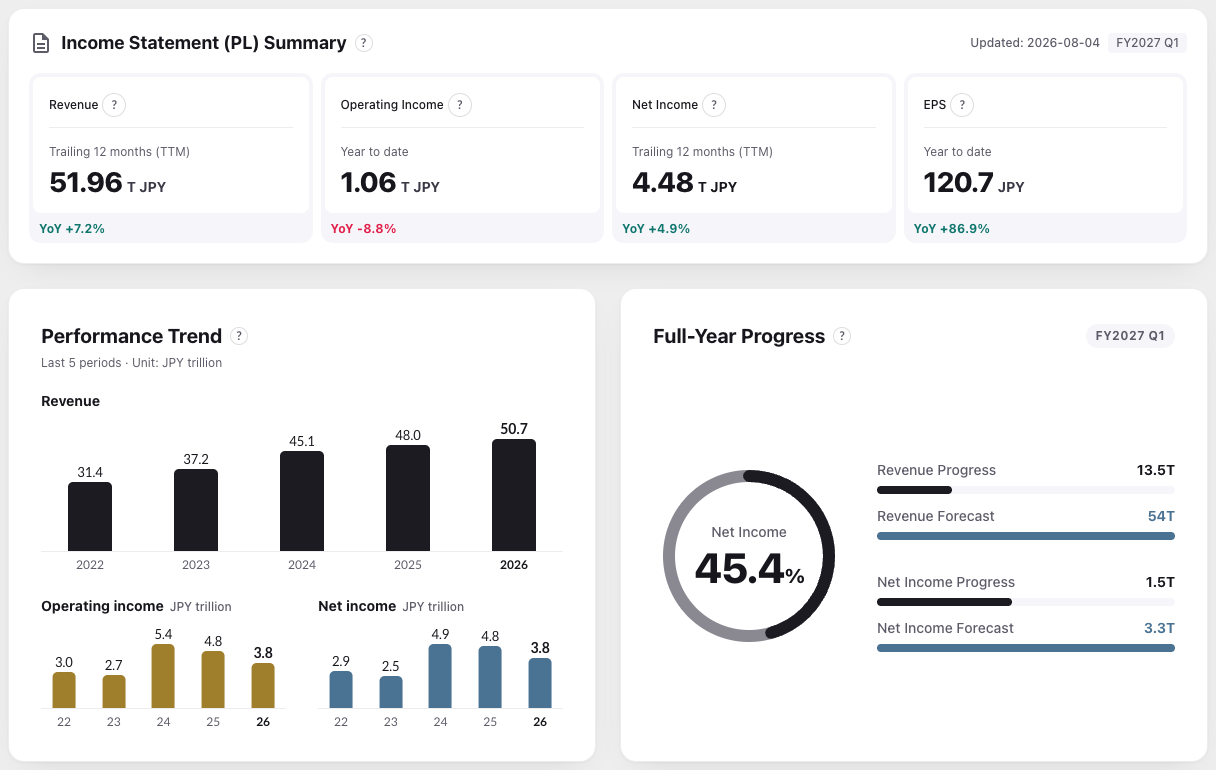
- 1Call /stable/income-statement without period to get quarters (Q1 to Q3) and full years (FY), newest first.
- 2TTM = latest year-to-date + last full year − same period a year earlier. The code below does exactly that.
- 3Each row carries provenance (the TDnet or EDINET document ID and the original’s URL), so the screen can link to the source filing.
Full-year results (Toyota Motor, 7203; drawn from a sample response)
| Fiscal year | Revenue | Operating income | Net income |
|---|---|---|---|
| 2026-03 | ¥50.68tn | ¥3.77tn | ¥3.85tn |
| 2025-03 | ¥48.04tn | ¥4.80tn | ¥4.77tn |
| 2024-03 | ¥45.10tn | ¥5.35tn | ¥4.94tn |
Source: S100Y8NY Open the original on EDINET →
// Trailing twelve months (TTM) from cumulative quarterly figures
  const rows = await get("/income-statement?symbol=7203&limit=12");
  const latest = rows[0];                                     // e.g. 2026-06 Q1 (cumulative)
  const lastFy = rows.find((r) => r.period === "FY");          // 2026-03 FY
  const sameQPrevYear = rows.find(
    (r) => r.period === latest.period && r.fiscalPeriod < latest.fiscalPeriod,
  );                                                          // 2025-06 Q1
  const ttmRevenue = latest.period === "FY"
    ? latest.revenue
    : latest.revenue + lastFy.revenue - sameQPrevYear.revenue;
4. Company dividend policy (annual report text)
StockClub’s company dividend policy is based on the policy stated in the annual securities report. ZENITH Code’s /stable/text-blocks returns the narrative sections of the report (business, risks, MD&A, dividend policy and more) as a table of contents and as text.
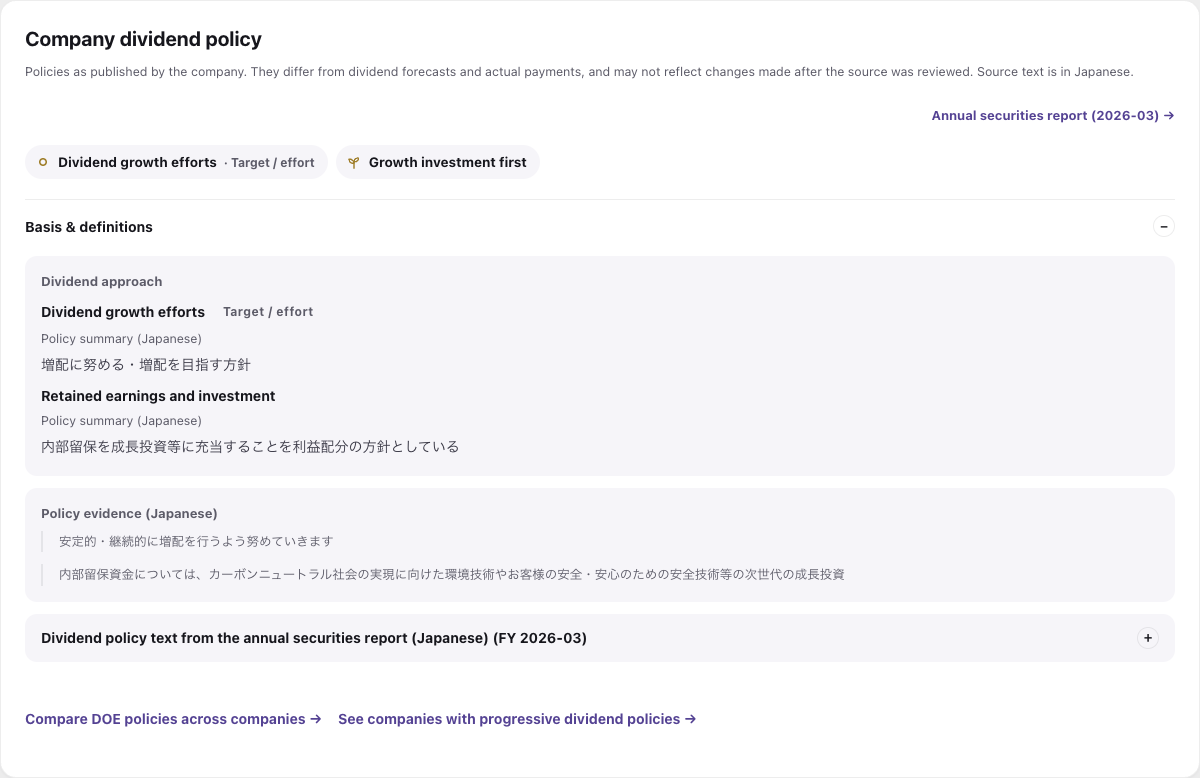
- 1Call it without tag to get the table of contents (tag, heading and length).
- 2Set tag to an alias such as dividend-policy or risks to get that section as plain text (or HTML with content=html).
- 3Sections can be long (MD&A in particular). On screen, pair them with a summary or extracted headings and link to the original.
Endpoints used
curl "https://api.zenithcode.net/stable/text-blocks?symbol=7203" \
  -H "x-api-key: YOUR_API_KEY"

curl "https://api.zenithcode.net/stable/text-blocks?symbol=7203&tag=dividend-policy" \
  -H "x-api-key: YOUR_API_KEY"
事業等のリスク (annual report for 2026-03; excerpt from a sample response)
17,543 characters
3 【事業等のリスク】 以下において、トヨタの事業その他のリスクについて、投資家の判断に重要な影響を及ぼす可能性のある事項を記載しています。ただし、以下はトヨタに関するすべてのリスクを網羅したものではなく、記載されたリスク以外のリスクも存在します。かかるリスク要因のいずれによっても、投資家の判断に影響を及ぼす可能性があります。 本項においては、将来に関する事項が含まれていますが、当該事項は有価証券報告書提出日(2026年6月10日)現在…
Open the original on EDINET →5. Company profile card
The company card at the top of a stock page. /stable/profile returns the Japanese and English names, sector, market, representative, address, headcount and business description in one call.
TOYOTA MOTOR CORPORATION
トヨタ自動車
- Market
- Tokyo Stock Exchange Prime Market
- Representative
- 取締役副社長 宮崎洋一
- Address
- 愛知県豊田市トヨタ町1番地
- Employees
- 390,927
Toyota Motor Corporation designs, manufactures, assembles, and sells passenger vehicles, minivans and commercial vehicles, and related parts and accessories in …
- 1sector is a TSE 33-sector code; map it to the Japanese or English name with /stable/available-sectors.
- 2Both nameJa / nameEn and descriptionJa / descriptionEn are included, so you can pick the one that matches your UI language.
- 3The response also includes the latest price, market cap and PER, which this card does not use. Check the Terms of Service before showing share prices.
Endpoints used
curl "https://api.zenithcode.net/stable/profile?symbol=7203" \
  -H "x-api-key: YOUR_API_KEY"
7. Screened stock list
A list of stocks filtered and ranked by criteria, like StockClub’s DOE dividend comparison or capital efficiency ranking. Use /stable/screener-presets for common screens and /stable/screener to combine your own criteria.
- 1Presets are high-dividend, value, high-roe, growth, dividend-growth and momentum; one call returns a ranked list (common stocks with a market cap of at least ¥5bn).
- 2With /stable/screener, pass ratios as decimals, such as roeMoreThan=0.1 for ROE of 10% or more, and sort with sortBy.
- 3Results come from a snapshot rebuilt every evening (Mon to Sat, 16:45 and 19:45 JST), so even whole-market screens return quickly.
curl "https://api.zenithcode.net/stable/screener-presets?preset=high-dividend&limit=20" \ -H "x-api-key: YOUR_API_KEY" curl "https://api.zenithcode.net/stable/screener?roeMoreThan=0.1÷ndYieldMoreThan=0.03&sortBy=dividendYield&limit=20" \ -H "x-api-key: YOUR_API_KEY"
Top 5 of the high-dividend preset (drawn from a sample response)
| Code | Company | Sector | ROE | Dividend yield |
|---|---|---|---|---|
| 6191 | AirTrip Corp. | Services | 12.3% | 11.1% |
| 8747 | YUTAKA TRUSTY SECURITIES CO.,LTD. | Securities & Commodity Futures | 27.7% | 10.3% |
| 4716 | ORACLE CORPORATION JAPAN | Information & Communication | 34.5% | 8.4% |
ROE and dividend yield are decimal ratios. This example does not show the price column.
Rules for displaying the data
Under Article 8 of the Terms of Service you may display ZENITH Code data in your own service and provide the results of processing it (indicators, charts, screening results and so on) to your end users. When you do, show the source (for example, “Data provided by ZENITH Code”) and make clear that the data is not warranted as accurate and is not investment advice. You may not redistribute or resell the data itself.
Read Article 8 of the Terms →Read next
How to use the same data from AI clients, and how complete the data is and how we check it.